The Space Weather Prediction Center doesn’t issue a G4 severe geomagnetic storm watch just to help photographers find a dark field. Behind the public alerts about auroras reaching as far south as Alabama or Virginia, regional grid operators are quietly reviewing mitigation playbooks. High-voltage transmission networks and polar aviation routes are bracing for a massive injection of solar energy that turns long conductors into liabilities.
The trigger is an energetic coronal mass ejection (CME) and a persistent, fast solar wind stream currently barrelling toward Earth. While the sky show dominates the headlines, these incoming charged particles compress Earth's magnetosphere, creating a live stress test for modern infrastructure. It is a collision of space weather and terrestrial vulnerability, exposing the slow, expensive reality of hardening an aging power grid against geomagnetically induced currents.
The Magnetic Coin Toss
Forecasting the exact strength of a geomagnetic impact remains inherently probabilistic. Forecasters can measure the speed of a solar wind stream and know a CME is arriving within a day, but the critical variable is the magnetic orientation upon impact. A direct hit with a prolonged "southward Bz" component produces a severe geomagnetic response, opening pathways for charged particles to flood the upper atmosphere.
Conversely, a northward magnetic field or a glancing blow might result in little more than a weak event, even from a fast-moving CME. This physical uncertainty forces the National Oceanic and Atmospheric Administration (NOAA) to issue early watches and update the probability in near real-time as the plasma actually hits.
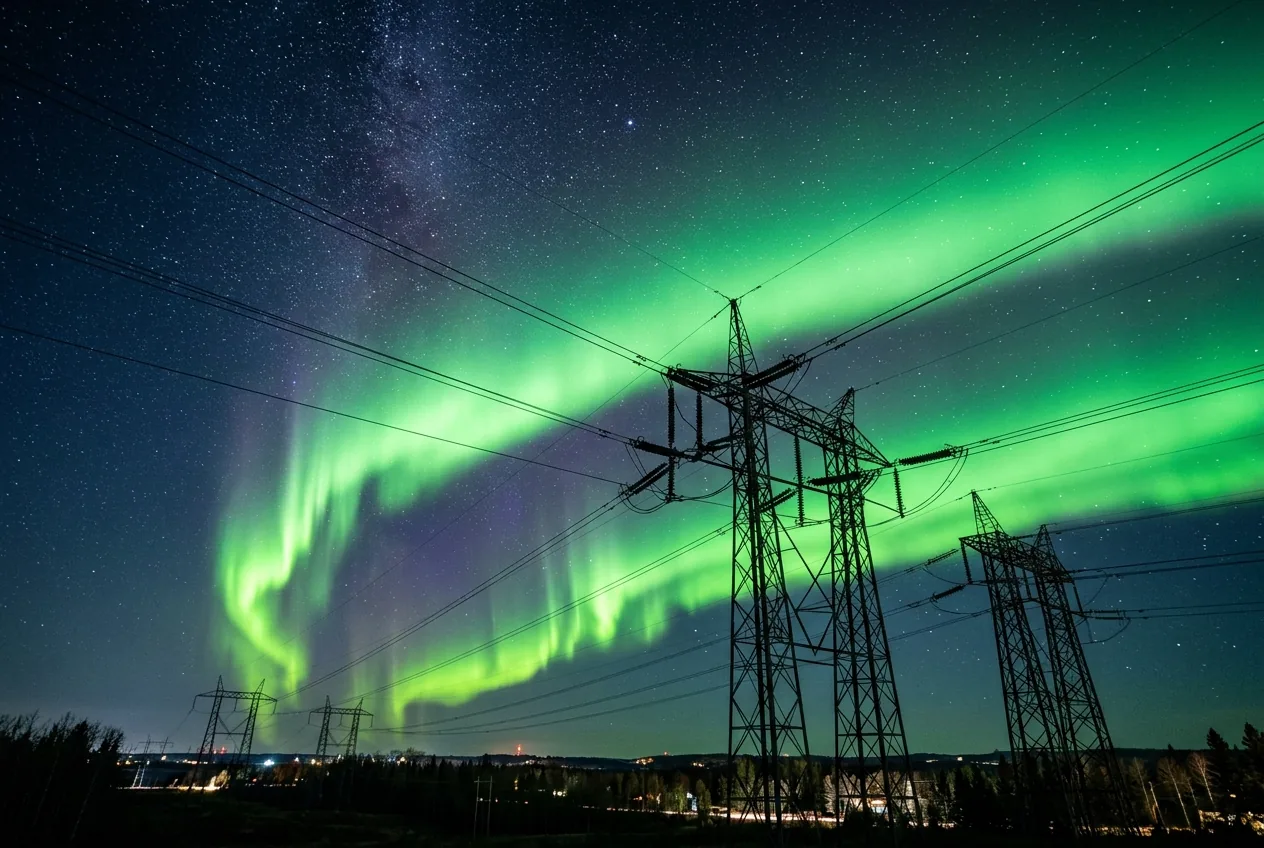
Saturation in the Wires
The same atmospheric physics that paint green and red glows over mid-latitude states also induce measurable currents in ground-based infrastructure. Geomagnetically induced currents (GICs) seek out long conductors, making high-voltage transmission networks at high latitudes—and long east-west lines in mid-latitudes—particularly exposed. When these currents surge into the grid, they can push massive transformers into magnetic saturation.
This saturation increases reactive power demand and, in rare instances, causes physical damage to equipment that is not easily or cheaply replaced. During a G4 event, utilities heighten situational awareness, sometimes pre-staging repair crews or reconfiguring networks to divert stress from vulnerable nodes.
Orbital and Aviation Cascades
The risk extends well beyond ground transformers. Aviation routes over polar regions routinely face high-frequency (HF) communication blackouts during severe solar storms. Airlines are often forced to reroute flights to lower latitudes, a pragmatic decision that burns additional fuel and cascades into global scheduling delays.
Meanwhile, satellite operators managing imagery, communications, and GPS positioning face a perturbed orbital environment. Satellites sit directly in the hazardous zone, enduring the radiation and signal degradation regardless of cloud cover or viewing conditions on the ground.
An Infrastructure Policy Choice
Preparedness in the utility and satellite sectors is entirely pragmatic, but tightly bound by budget constraints. While grid operators run exercises and rely on NOAA’s increasingly accurate lead times, early warnings do not eliminate the underlying physical vulnerabilities of the hardware. Upgrading large systems and replacing aging transformers is a slow, expensive process that utilities are rarely eager to self-fund without regulatory pressure.
Space weather prediction has improved, but the grid absorbing the blow remains an infrastructure policy choice as much as a scientific one. The sun’s ejections are perfectly natural; the fragility of the wires catching them is entirely engineered.
Sources
- National Oceanic and Atmospheric Administration (NOAA) Space Weather Prediction Center


Comments
No comments yet. Be the first!