Lede: In the laboratory's glass and brine
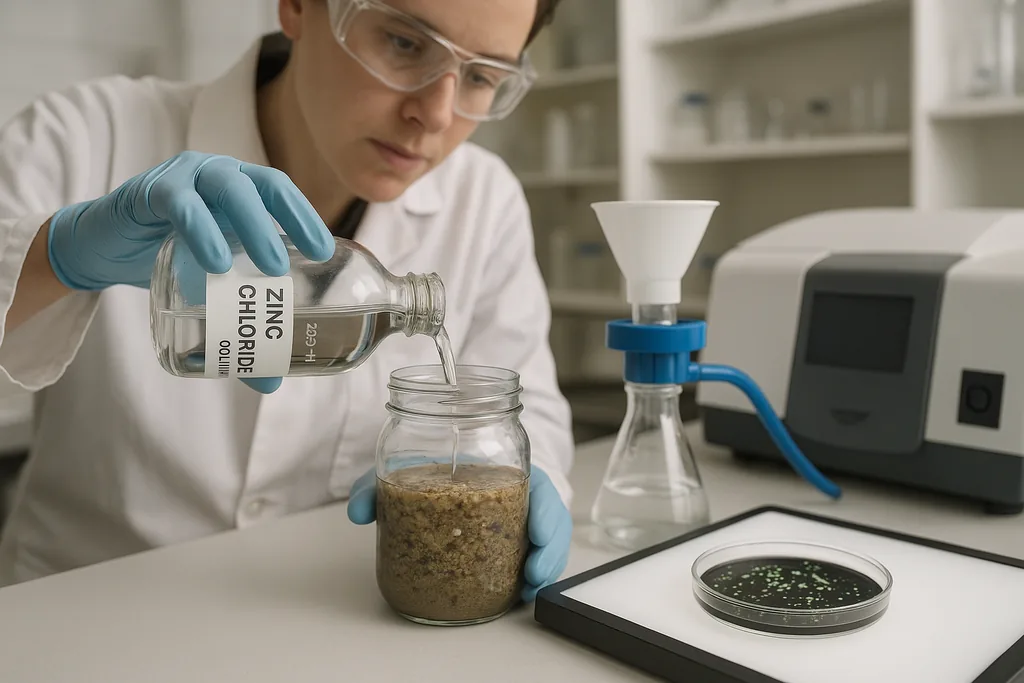
Under a fume hood, a researcher pours a heavy zinc chloride solution into a jar of coastal sediment and watches lighter fragments float to the surface. The next day, those floated particles will be stained, photographed and fed to spectrometers that try to read the plastics' chemical fingerprints. Every step — the chemical used to dissolve organic matter, the density of the brine, the dye or instrument chosen for detection — can change which particles are recovered, which are counted and even whether a sample is judged to contain plastics at all.
Separation and pre‑treatment
Before any identification can happen, microplastics must be liberated from the matrices that hide them: sand, sludge, algae or animal tissue. Density separation — adding a salt solution so lower‑density plastics float — remains the workhorse approach. Researchers use a range of salts: common table salt (NaCl) for low density polymers, sodium iodide or zinc chloride for denser polymers such as polyethylene terephthalate (PET) and polyvinyl chloride (PVC). Larger and better‑validated brine solutions generally recover a broader range of polymer densities, but they bring trade‑offs in cost, toxicity and waste handling. Controlled tests show that higher‑density solutions such as ZnCl2 and NaI give systematically higher recovery of dense polymers than NaCl, but NaCl remains attractive for routine, low‑cost monitoring because it is safer and widely available.
Visual screening and staining
After extraction, many labs use visual screening to triage particles. Staining with Nile Red — a lipophilic fluorescent dye — highlights plastics under blue light and can speed up counting and imaging. When applied under controlled conditions Nile Red is fast, inexpensive and sensitive for a range of polymers and sizes, and it has been adapted for sediments, waters and even some biological samples. But Nile Red is not a silver bullet: it also stains organic residues and can overestimate particle counts if digestion is incomplete, and its sensitivity drops for very small fragments. Operators must therefore combine staining with confirmatory chemical analysis for robust results.
Spectroscopy and imaging
Definitive polymer identification typically requires vibrational spectroscopy — Fourier transform infrared (FTIR) or Raman spectroscopy — which read molecular vibrations to produce polymer “fingerprints.” Micro‑FTIR imaging and Raman mapping can identify particles to a few micrometres in size and, when paired with automated image analysis, greatly reduce analyst bias and time. But technologies differ: Raman excels at very small particles and offers high spatial resolution, whereas FTIR-based focal plane array imaging is faster over larger filter areas. Automated platforms trade speed for potential false positives or missed small particles; careful calibration, reference libraries and semi‑automated workflows often deliver the best compromise between throughput and accuracy.
Quantitative thermal methods
Where mass or polymer‑specific mass estimates are required, thermal techniques such as pyrolysis‑gas chromatography–mass spectrometry (Py‑GC‑MS) are widely used. These methods thermally break polymers into characteristic fragments, which are then separated and identified to yield polymer type and mass. Py‑GC‑MS is powerful for bulk quantification and for complex matrices where single‑particle spectroscopy is impractical, but it has known limitations: matrix interferences can produce overlapping pyrolysis products and raise false positives, particularly for polymers like polyethylene when samples contain fats or other organics. Recent methodological work has improved extraction and marker‑selection strategies to lower false positives and to push detection limits, but the technique demands rigorous blanks, matrix‑matched controls and conservative interpretation of small signals.
Quality control, contamination and reproducibility
Microplastic analysis is exceptionally vulnerable to contamination — airborne fibers, synthetic lab clothing and plastics in bench consumables can all appear in blanks and bias results. High‑quality studies therefore include procedural blanks, field blanks, spiking/recovery tests and replicated processing to quantify and correct for contamination and recovery efficiency. Recent critiques of high‑profile human tissue studies underscore the stakes: when matrix interferences and weak contamination controls are present, chemical signals can be misread as plastics, prompting calls for more conservative methods and shared validation standards. The field is rapidly moving toward mandatory quality‑control checklists and inter‑laboratory comparisons to make datasets comparable.
Practical recommendations for researchers and monitoring programs
Design the workflow around the matrix and question. For beach or sediment surveys aiming to enumerate particles >300 µm, a simple NaCl density separation plus visual sorting can be adequate; for comprehensive polymer inventories or measurements of dense polymers, use higher‑density solutions and validate with recovery experiments. Combine a fast screening tool — Nile Red or visual imaging — with confirmatory spectroscopy for subset verification. For mass‑based assessments, use Py‑GC‑MS but pair it with strict matrix‑matched controls and conservative marker sets to avoid false positives. Report recoveries, blanks and detection limits alongside counts or masses so readers can judge how method choices shaped results.
Where the field is heading
Automation, machine learning and harmonised international standards are converging to make measurements faster and more comparable. Advances in Raman and FTIR imaging, and hybrid workflows that marry single‑particle spectroscopy with bulk thermal methods, are expanding both detection ranges and confidence in polymer IDs. At the same time, critical methodological reviews and inter‑lab comparisons — including efforts to clarify Py‑GC‑MS limitations in biological matrices — are forcing the community to adopt stricter controls and clearer reporting. Those changes matter: policymakers, health scientists and the public rely on robust methods to justify regulation, assess exposure and prioritize interventions.
Sources
- Environmental Science & Technology (Hurley et al., 2018; method validation for complex matrices)
- University of Queensland (Rauert et al., 2025; Py‑GC‑MS efficacy in human blood)
- Marine Pollution Bulletin (Nile Red staining studies)
- Analytical Methods and MethodsX (density separation validations and overflow method)
- Scientific Reports and Chemosphere (comparative studies on pre‑treatment and density solutions)
- ACS ES&T Engineering (Fenton's reagent and thermal Fenton approaches)


Comments
No comments yet. Be the first!